Author Archives: admin

SafetyBarrierManager supports SVG

Since Version 3.2, SafetyBarrierManager supports SVG (Scalable Vector Graphics).

When saving a graph (see also the post about the lack of printing options), you can now choose the option “svg”. The big advantage of svg graphics is that they remain sharp and crisp, even when they are scaled up or down by large factors. Microsoft® Office 365 allows you to drop svg graphics in e.g. Word, Excel and Powerpoint.

Did you ever try to zoom in on a detailed graphic in a pdf file? Very probable the small text remained unreadable – this is over when using svg. The resolution of svg graphics is endless. Although it neither was nor is good practice to insert graphics that cannot be read at page size, svg overcomes a bit of the disadvantage.

The html-export of SafetyBarrierManager uses svg too. Also here it allows endless zooming in and out, and improves user interaction. Visit the examples in the Gallery and try for yourself.

SafetyBarrierManager Update 3.2 (October 2019)

SafetyBarrierManagerIcon

SafetyBarrierManager Update 3.2 has been issued. Most of the changes are “under the hood”. The only “notable” change is that SafetyBarrierManager now supports Scalable Vector Graphics (SVG). Not only can you save the graphics as SVG files, but also the HTML exports use SVG. SafetyBarrierManager let you share the results of your analysis as HTML files. These HTML files are much smaller when using SVG and, more important, the graphics can be zoomed in and out without limitation, staying clear and crisp. Try one of the examples from the Gallery, such as the ExampleProject.

The changes “under the hood” are also important: the quantification using Binary Decision Diagrams has been re-programmed as part of the core code. DLL-files are no longer needed, and the calculations are much faster. And it prepares for the future development of dynamic risk analysis, which will be integrated in the shareable HTML exports.

To get SafetyBarrierManager go to the Download page – the un-registered version limits editing of larger projects, but it has all other functionalities.

SafetyBarrierManager update 3.1

Update 3.1 of SafetyBarrierManager has been issued. Thanks to the feed back from users, the use of the mouse and mouse buttons is in line with how most other applications use the mouse. There are a few other added functionalities and new explanatory sections in the help file. The feed back from users is highly appreciated!

At the same time, some improvements have been made to the SafetyBarrieriViewer for a better user experience.  Touch devices (tablets, smart phones) are now better supported. These changes apply to already uploaded projects, so everyone benefits. Some tablets and smart phones will require to empty the browser cache before the changes take effect (e.g. Safari: “clear list”)

The Change List contains all changes in the new update.

Printing in SafetyBarrierManager

Some users have asked where to find the “print” button in SafetyBarrierManager. There is none. There is a “Save Graph” and “Save to Clipboard” button instead.  SafetyBarrierManager focusses on the tasks to create the safety-barrier diagrams. The graph is one part, the underlying data another. These parts cannot stand alone. Analysists want to format there reports with the necessary data. So the graphs can be exported as image files, (png, bmp or svg) and the data tables and risk matrix can be exported as Excel® sheets. These data can be copied into any text editing software and printed from that. So rather than making SafetyBarrierManager (more) complex with print formatting options, we leave this to the tools that are much better at this. You can change the Excel sheets at will, changing format, deleting columns, etc..

Bitmap-based image files (bmp and png) are saved with the resolution (“zoom”) chosen. Set “View-Zoom” to 200% or higher so you get good quality graphs in documents. Alternatively, use the “svg” option (as of version 3.2). SVGs (Scalable Vector Graphics) have high resolution irrespective of the zoom factor. SVGs can be imported into Microsoft Office 365 documents.

The difference between the “Save Graph” and “Save to Clipboard” is that the latter (apart from not saving to a file) will copy the visible mark-up in the graph (typically the dashed contours around selected elements) as well.

Graphs and tables can be exported and copied into a text editing program

SafetyBarrierManager version 3

Version 3 of SafetyBarrierManager has been released.

Web-publishing

SafetyBarrierManager version 3 contains a major new feature: “SafetyBarrierIViewer”. It is the possibility to generate web pages with the safety-barrier diagrams and all related information. Al the information that can be accessed through the original windows application is also accessible in the web page, that is, when clicking on an element in the diagram (e.g. a barrier), the information on that barrier, such as description, probability of failure on demand, type, etc., becomes visible in the panel below the diagram.

SafetyBarrierIViewer - example view

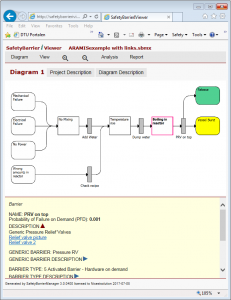
Web page of safety-barrier diagram

Tabular information, risk matrix, etc. are also included in the web page.

This is a feature to distribute safety-barrier diagrams within your company or with other stakeholders (e.g. authorities, clients) without the need for them to install the separate “SafetyBarrierViewer” windows program. This means that the safety-barrier diagrams are accessible from all platforms with ordinary browsers, such as tablets and smart phones.

The web pages can be uploaded to a server directly from the SafetyBarrierManager application through FTP. If necessary, Nicestsolution can provide password-protected  access to its server to upload and share safety-barrier diagrams.

We are building a gallery of web-published diagrams, where you can see the possibilities of the web pages and the different ways of building accident scenarios by SafetyBarrierManager.

Improved usability

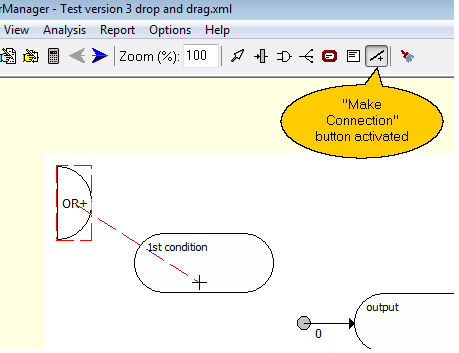
SafetyBarrierManager version 3 introduces “drag-and-drop” to build safety-barrier diagrams (or fault trees, or event trees). Especially the possibility to draw the links between the visible elements improves usability.

Drag-and-Drop

“Drag-and-Drop”, to put elements on the diagram and to draw connections between them

Display of event trees

SafetyBarrierManager version 3 includes more freedom to customize the event trees, so they can be designed to look like other tools present event trees.

Event tree

New possibility of displaying event tree

New release of SafetyBarrierManager – with “update” facility (February 2017)

Update 2.1.1400 has been released today. Apart from some bugfixes (see the change history), the main improvement is the “update” facility. This makes it much easier to maintain project files that share the same elements. Changes made in one project can be transferred to another project, keeping all projects up to date with a minimum of effort. Especially useful if you keep two copies of a project, one with a large, merged diagram, and another where the diagram is split into small pieces. Both presentations have their benefits, and now only one of the projects need to be maintained. You can download the release from the Download page.

New version 2.1 is released (September 2016)

An intermediate new version of both SafetyBarrierManager and SafetyBarrierViewer has been issued. Apart from  some bugfixes, the following improvements have been included:

New projects

The “New Project” button now leads the user through an intuitive process of starting a new project. The new project is either based on a template, an existing project or built completely from scratch. The installation file contains about 4 templates. All the necessary steps are prompted, so that the user quickly and smoothly arrives at the point where one can “draw barriers”. The Help file is updated accordingly.

Associated file types

The program now can use input files with specific extensions: “.sbmx” for project files, and “.sbmt” for template files. These file types are associated with the SafetyBarrierManager program, and have their own icons:

Icon for sbmx file type Icon for sbmt file type

Double clicking such a file in the Windows file explorer will start the program and open the selected file.

Input to AND gate

The program did not allow more than one input of type “event” (characterized by an expected frequency of occurrence) as input to a logical “AND” gate. This is too restrictive: if events originate from the same precursor event, this should be allowed, and this has now been implemented in the new version. So the following construction is now possible:

Of course, this diagram is logically equivalent with:

But sometimes one wants to collect the alternative outputs of a scenario, and the first diagram can be split into two diagrams at the events “B1 passed” and “B2 Passed”. The help file explains the requirements for AND and OR gates.

DTU has transferred copyright to Nicestsolution

On March 21st, 2016, the agreement was signed by the President of the Technical University of Denmark (DTU), professor, dr.techn. Anders Bjarklev, and the proprietor of Nicestsolution, Nijs Jan Duijm, M.Sc., that transfers the copyright and ownership of the software “SafetyBarrierManager” to Nicestsolution. From now on, Nicestsolution will take over the support to current licensees as well as further development of the software.

Version 2 is released (October 2015).

Read about the new features in version 2. License holders with an annual license are automatically entitled to use this version. License holders with a perpetual license need to check whether they need to upgrade, according to the upgrade policy. If you have acquired a perpetual license after January 1st, 2015 you are entitled to use this version. No further updates will be provided for version 1.