Cumulative list of software updates and bugfixes in version 3
New features and software updates of version 3 as compared to version 2 are described at the bottom of this page.
Software updates in version 3.2.2604
The HTML export generates a html file allowing the file to be distributed via secure (SSL/TLS, “https”) connections.
Software updates in version 3.2.2206
The risk matrix can now also be defined for consequence conditions presented by probability (was previously limited to consequence events presented by expected frequency).
Software updates in version 3.2.1206
All files (notably svg and txt files) are now saved with UTF8 encoding (svg-graphs not being saved as UTF8 caused browser error when encountering non-ASCII characters)
Graphs saved as svg have now a transparent background.
Software updates in version 3.2.1020
HTML export generates integrated SVG graphics to replace the PNG graphics (lower overhead, and unlimited zooming without loss of resolution). In parallel, the JavaScript and CSS resources have been updated.
“Save Graph” can also save as SVG.
Bugfix: Arrow buttons “next” and “previous” diagram are now updated (bug introduced with 3.1.1214).
Reprogramming of BDD quantification: now included in the core code, no DLL’s needed.
Review of code to avoid memory leaks.
Software updates in version 3.1.1214
Bugfix to ensure identical relative placement of elements irrespective of the scale of view.
“Undo” facility added for: Merge, Split, Cleanup Conditions, Align Consequences, Align Initiating Events, and Auto-layout for Measures.
Software updates in version 3.1.1209
Bugfixes and minor improvements: Sizing of the margins around the graph (to handle various “Snap grid” settings); Connecting elements (ensuring names and IDs of the automatically created conditions are unique and avoiding error messages when clicking outside elements); Centring the diagram on resizing of the diagram control.
Software updates in version 3.1.1200
Bug fix for connecting elements in “drop and drag” (bug introduced in version 3.1.1102).
Bug fix for vertical and horizontal sizing of text boxes below event tree branches (in the previous version the settings for barriers were used erroneously).
Two barriers can now be linked together directly in “drop and drag” (the intermediate condition is generated automatically and hidden). This allows easier construction of “bow-tie” type diagrams.
Margins around graphs account for the text boxes below barriers and event tree branches.
Software updates in version 3.1.1102
No “alt” key for moving elements. Based on input from users, moving of elements in the graph no longer requires to press the “Alt” key. On selected elements, just hold the left mouse button to move (so first click + release to select, then press again to move). (But the old method with the “Alt” key still works).
Disable double-click to enter “edit”. Spurious activating the edit forms by double-clicks becomes even more annoying with the new method of moving. Therefore one can disable the that double-click will open the edit forms (Main Menu under “Options -> Preferences”. To open the Edit forms, use the “Edit Element” item in the right-mouse drop-down menu on selected elements.
Align initial events and consequences. With a single command one can align all initial events and all consequences in a diagram on a vertical line under the Main Menu “Layout”. Also the action “Auto layout with Measures” has been moved to this menu heading.
New sections in the help file. Some explanatory sections have been added to the help file, viz. on quantification (calculation of probabilities) and printing (or the lack of printing options).
Flexible handling of “Critical Events”. Critical Events were only allowed inside the diagrams (not as initial event or as a consequence). This limitation has been removed, so the Critical Event can also be at the edges of the diagram. That allows the piece-wise development and presentation (e.g. separate graphs for the left-hand and the right-hand side of a bow-tie. It is ensured that if an event is selected as critical event in one diagram, the same event will become critical event in all the diagrams where that event appears.
Minor bugfixes:
- The vertical distance between nodes in an event tree branch is no longer limited
- The “Edit Project” menu item and corresponding tool button are now enabled if a project is opened directly from Windows Explorer
Software updates in version 3.0.0610
- An error occurred when removing a condition that is not used (not linked to another element) but still visible in a diagram.
- When editing “new” elements in edit forms, the “remove” button shall be disabled; this is now ensured for all edit forms.
Software updates in version 3.0.0600
Version 3.0.0600 features the following software updates:
- Repair of serious bugs in version 3: failure of “update” function and “split” and “Separate Trunks” functions
- Scrolling of Barrier Diagram Display is improved; the scroll position remains in place after editing elements of the diagram
- “Invisible” “OR” gates are now always moved directly adjacent to the output condition, this avoids that 2 arrow heads may appear on the connection between the input and output conditions (please provide feedback if this feature needs to be made optional)
- The red boxes around empty “name” fields in the edit forms have been replaced by a kind-of-pink background of the fields, this makes the forms visually more “quiet”.
- The example diagrams in the installation package have been updated and improved. A fourth template has been added, featuring different coloring of barrier types (for passive, pro-active, hardware and procedural barriers)
- Checks have been added to avoid that logical elements can have the same input as output condition when using the “drag” feature.
Software updates in version 3.0.0530
Repair of the error version 3 that caused the program to fail when opening through clicking associated file types (*.sbmx) and when the user had downloaded custom terminologies.
Software updates in version 3.0.0510
- All consequences (also those being initiating conditions in other diagrams) are now visible in the “consequence table” and risk matrix (if severity has been assigned).
- Applying “Auto Layout with Measures” enables the “Save” button.
Software updates in version 3.0.0500
- The function “Auto Layout with Measures” has been rewritten and is expected to provide reasonable lay-outs for most diagram designs.
- It is now possible to quantify diagrams that make use of “preventive barriers” (barriers connected on the left-hand side of initiating events) without the need to use “dummy” initiating events. Of course, the probability of function on demand of the preventive barriers is not include in the quantification (because there is no “demand” in the diagram).
- Correction of a non-fatal bug introduced in version 3 related to closing projects with diagrams exceeding the size of the canvas.
- Disabling the option of showing consequences with risk matrix colors if there is no matrix defined.
Software updates in SafetyBarrierManager version 3.0.0100 since version 2.1
Export to HTML / SafetyBarrierIViewer
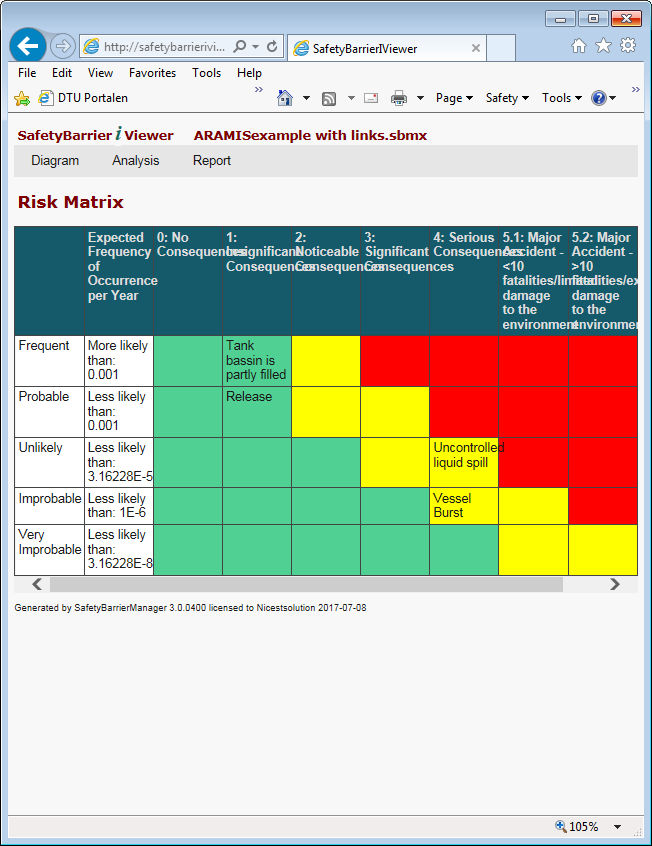
Browser view of risk matrix
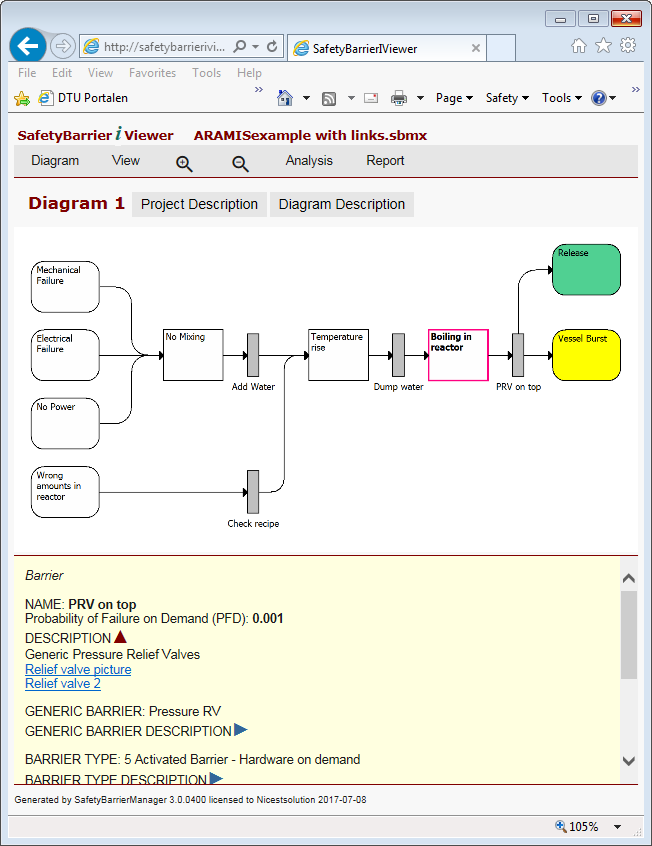
Browser view of safety-barrier diagram
The results of SafetyBarrierManager can now be exported to an HTML file with image files to show and share the diagrams and all data tables using ordinary browsers. The files can be directly uploaded to an internet page (Nicestsolution offers pages under the safetybarrieriviewer.duijm.dk domain, see the pricelist and upgrade policy for details). The diagram has the same functionality as the SafetyBarrierManager windows app, so elements on the graph are clickable to display the underlying information in the panel below the diagram. The diagram can be zoomed and showed on full page.
One can switch between views with/without displaying probabilities, dependencies between barriers, and Risk Reducing Measures.
All tabular information from the SafetyBarrierManager windows app is available including risk matrix and analysis of Critical Events and Consequences.
Drag-and-drop
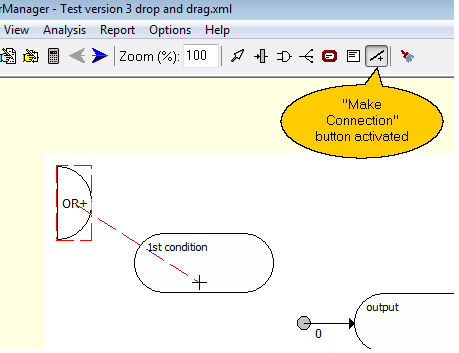
“Drag-and-Drop”, new toolbar to put elements on the diagram and to draw connections between them
It is now possible to draw barrier diagrams by drag-and-drop using new buttons in the toolbar. The diagram is now centred in the diagram display, so new elements (conditions, barriers, gates) can be placed all around the existing diagram. Especially the possibility to draw links between elements will be an enhancement as compared to the “old” way of selecting links to/from conditions via drop-down lists, especially for large projects with many conditions.
New options for displaying event trees

New possibility of displaying event tree
There are new possibilities for customizing the way event trees are displayed, so they look more like how other tools present event trees.