The SafetyBarrieriViewer webtool shows the safety-barrier diagrams almost identical as the SafetyBarrierManager desktop program.
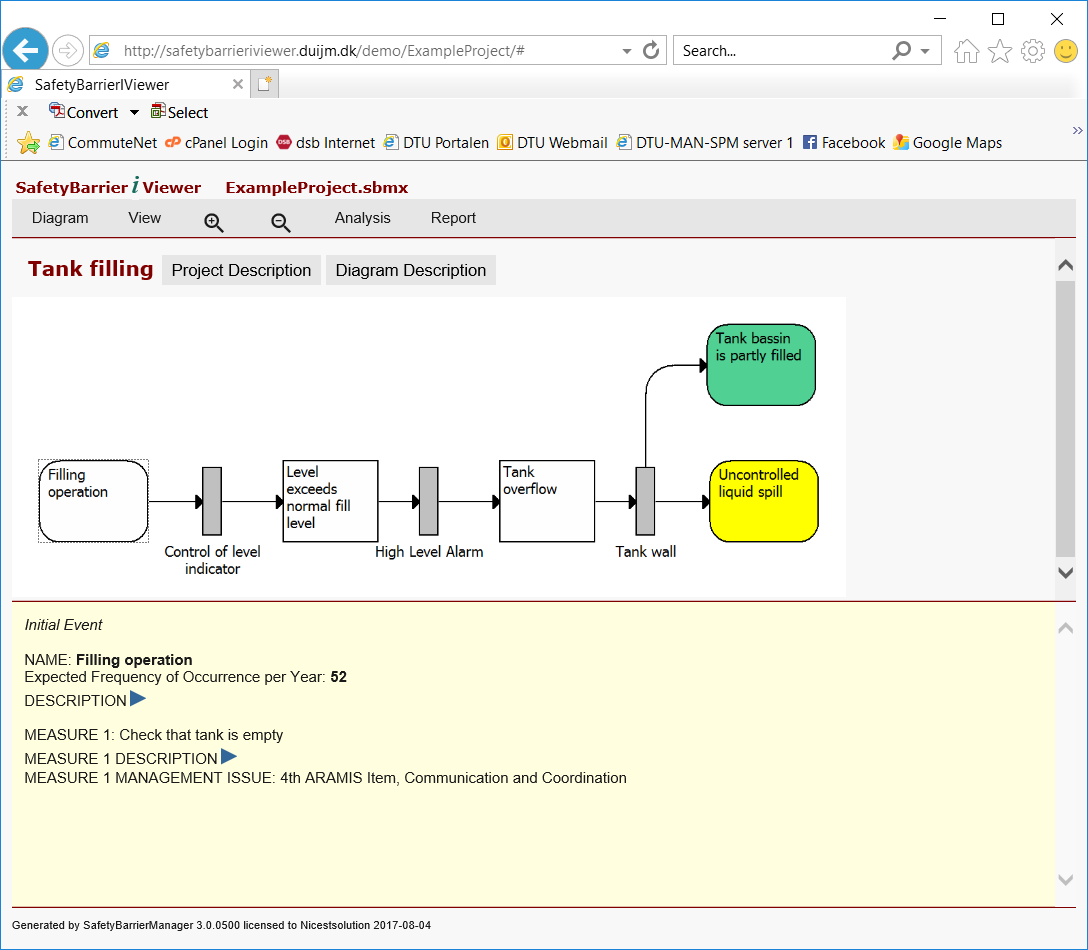
On the top of the page is a menu. Selected options are shown with a turquoise background
- “Diagram” let you choose what diagram to show
- “View” let you see how to show the diagram (with Measures, with Probabilities, with Dependencies indicated, and Full page, that is without the yellow infoblock at the bottom)
- “Zoom in” and “Zoom out” to adjust the size of the graph: each click moves the zoom factor a little.
- “Analysis” let you choose three forms of analysis in table form: a list of Consequences, Critical Events (if these are defined) and a Risk Matrix.
- “Report” let you choose to show tables of all the different types of elements in the diagram.
Clicking on an element inside the diagram will show you the information on that element in the yellow infoblock at the bottom of the page. Descriptions can be expanded by clicking on the blue triangle.
You can also press the buttons after the diagram title (above the graph, below the menu), to show the information on the project or on the barrier diagram that is displayed.