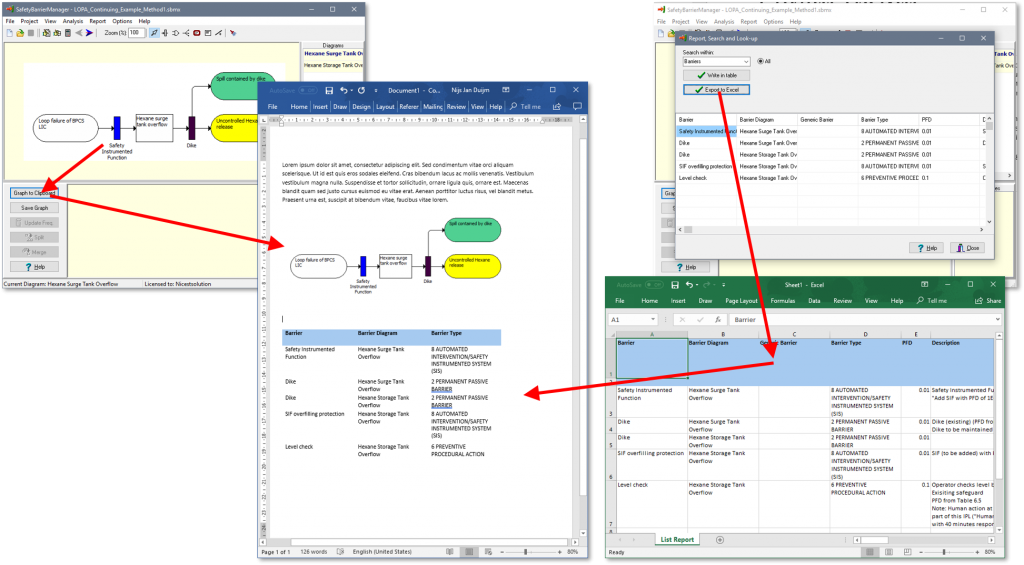
Some users have asked where to find the “print” button in SafetyBarrierManager. There is none. There is a “Save Graph” and “Save to Clipboard” button instead. SafetyBarrierManager focusses on the tasks to create the safety-barrier diagrams. The graph is one part, the underlying data another. These parts cannot stand alone. Analysists want to format there reports with the necessary data. So the graphs can be exported as image files, (png, bmp or svg) and the data tables and risk matrix can be exported as Excel® sheets. These data can be copied into any text editing software and printed from that. So rather than making SafetyBarrierManager (more) complex with print formatting options, we leave this to the tools that are much better at this. You can change the Excel sheets at will, changing format, deleting columns, etc..
Bitmap-based image files (bmp and png) are saved with the resolution (“zoom”) chosen. Set “View-Zoom” to 200% or higher so you get good quality graphs in documents. Alternatively, use the “svg” option (as of version 3.2). SVGs (Scalable Vector Graphics) have high resolution irrespective of the zoom factor. SVGs can be imported into Microsoft Office 365 documents.
The difference between the “Save Graph” and “Save to Clipboard” is that the latter (apart from not saving to a file) will copy the visible mark-up in the graph (typically the dashed contours around selected elements) as well.
