Safety-barrier diagrams show the safety barriers that are in the way between adverse, initiating events and a real accident. From the diagram it can be seen how many barriers have to fail before the accident occurs. Although the diagram shows the worst case (all safety barriers fail), the interesting thing from the diagram is that it shows all the opportunities that the barriers provide to stop the accident.
So a barrier diagram can be displayed as follows:
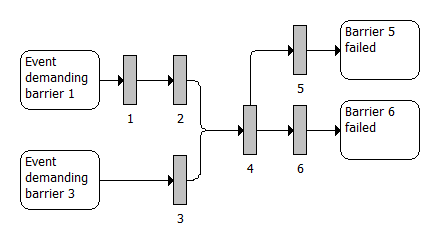
An arbitrary safety-barrier diagram with barriers numbered 1-6
Safety-barrier diagrams show accident scenarios. The fact that the safety-barrier diagram shows a scenario means that the order of the safety-barriers from left to right is important. The order of the barriers shows the sequence in which the barriers would be triggered in a real incident, so the left-most barrier is activated first, and the right-most barrier last.
The information in a safety-barrier diagram is the same as in a fault tree or event tree. The advantage of safety-barrier diagrams is that they are much easier to understand than a fault tree, because the complex description of the behaviour of the barrier is captured in this single symbol of a barrier blocking the path from one event to the next.
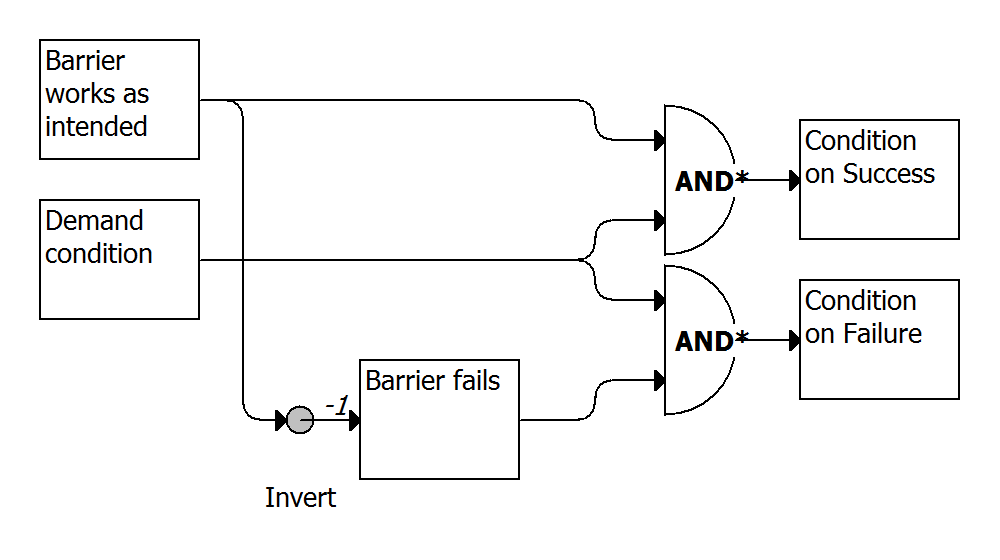
The complex fault tree of a safety barrier
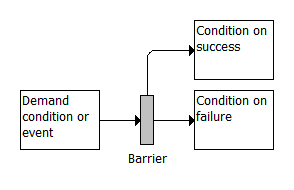
Presentation of a safety barrier in a safety-barrier diagram
The principles of identifying barriers is identical to the method of finding Independent Layers of Protection in the Layer-Of-Protection-Analysis (LOPA, see the AIChE book). (The correspondence between LOPA and safety-barrier diagrams will be described in another page – pending)